There are 3 options provided in this assignment, you must complete one of these options. For any option, the assignment requires a report to be written, detailing the investigation, the results and the conclusions which can be drawn. The report should be type written.
The first option does not require any computer programming as programs are provided. The other two options require programs to be written. The 1st option is more analytical and hence a more detailed analysis of the outcome is expected from the report.
 |
Option 1 - Frequency Response of Images |
|
Option 2 - Histogram Specification |
|
Option 3 - Phase Manipulation |
The report must be submitted to the student office (Room 1.56) by 5pm on Friday 9th March 2001 (End of week 9 of term).
However, xv can only display integer images (8 bits - grey levels 0- 255). Therefore, if you want to look at floating point images you will need to convert them to integer images (see notes on programs in Option 1). All of the input images are in integer format.
On PCs you will use matlab to visualise the data.
The aim of this assignment is to investigate the frequency response of images. The first stage of the project involves swapping the phase response of one image with another and then calculating the inverse transform. Discuss what information this provides concerning the phase of the image. The method is summarized below. The second stage involves investigating the quantization of the magnitude and the phase.
Method:
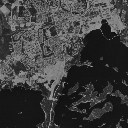
You should use the four tif images contained in
~ceeyrp/Teaching/225SD2/Images during your investigation. These images
include a photographic image (lena), a sonar image (sonar),
a synthetic aperture radar image (sar) and a landsat image
(landsat).
lena.tif  sonar.tif
The final report should discuss the effect of swapping the phase responses on the various types of images and the effect of quantization. It should explain the results obtained and detail what conclusions can be drawn from these results.
For example: Are there any conclusions you can draw about the images? Any conclusions about the phase response? Magnitude response? the effect of quantisation of the magnitude response and/or the phase response?
The following programs are available:-
These programs can be downloaded freely from this page. Place them in your working matlab directory. Launch matlab on your PC, wait for the prompt and do cd my_directory (full path). The programs can now be used. For a complete description, type help program_name
Write a program which can read in a file of numbers specifying a desired histogram and an image to be manipulated. The program will perform the histogram specification on the image given and output the new image. Then, investigate the effect on the images when different histograms are specified (for example a uniform histogram, a ramp, a Gaussian etc.).
The report should contain details of the method and program, in addition to discussing the results of applying the different specifications.
You can again use the tif images mentioned for option 1 (see section images)
The input file specifying the desired histogram can either be created by typing in values into a file or by writing short programs which will write out to a file numbers specifying the desired histogram.
Given an image which consists of a white square on a black background investigate how to move the square around the image by manipulating ONLY the phase response.

You should use the four tif images contained in ~ceeyrp/Teaching/225SD2/Images during your investigation.
You may also want to try applying this technique to other images.
The report should contain information about the method you applied and any programs used and will show some results.
You may wish to use the fft2d program described in option 1. This will permit you to obtain the magnitude and phase responses, then you can write your own program to manipulate the phase response, before using ifft2d to do the inverse Fourier transform back to the spatial domain.